See Real Conditions on the Grid
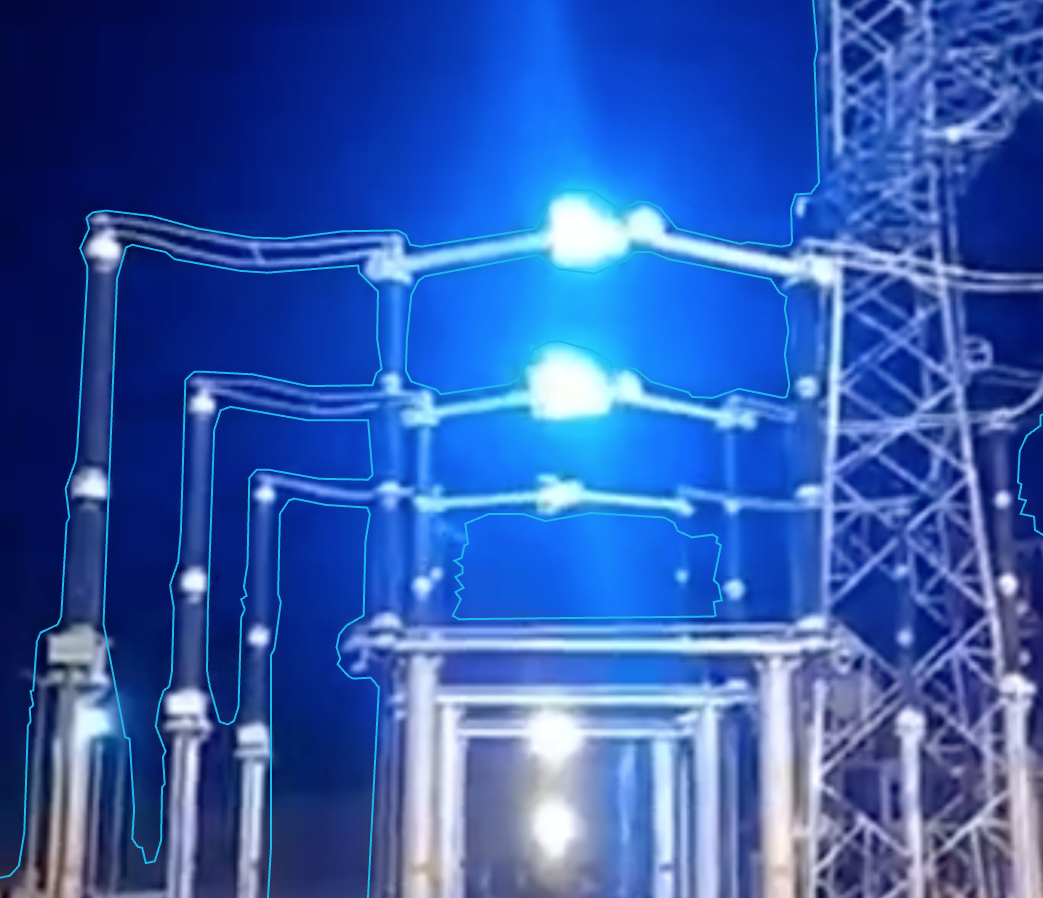
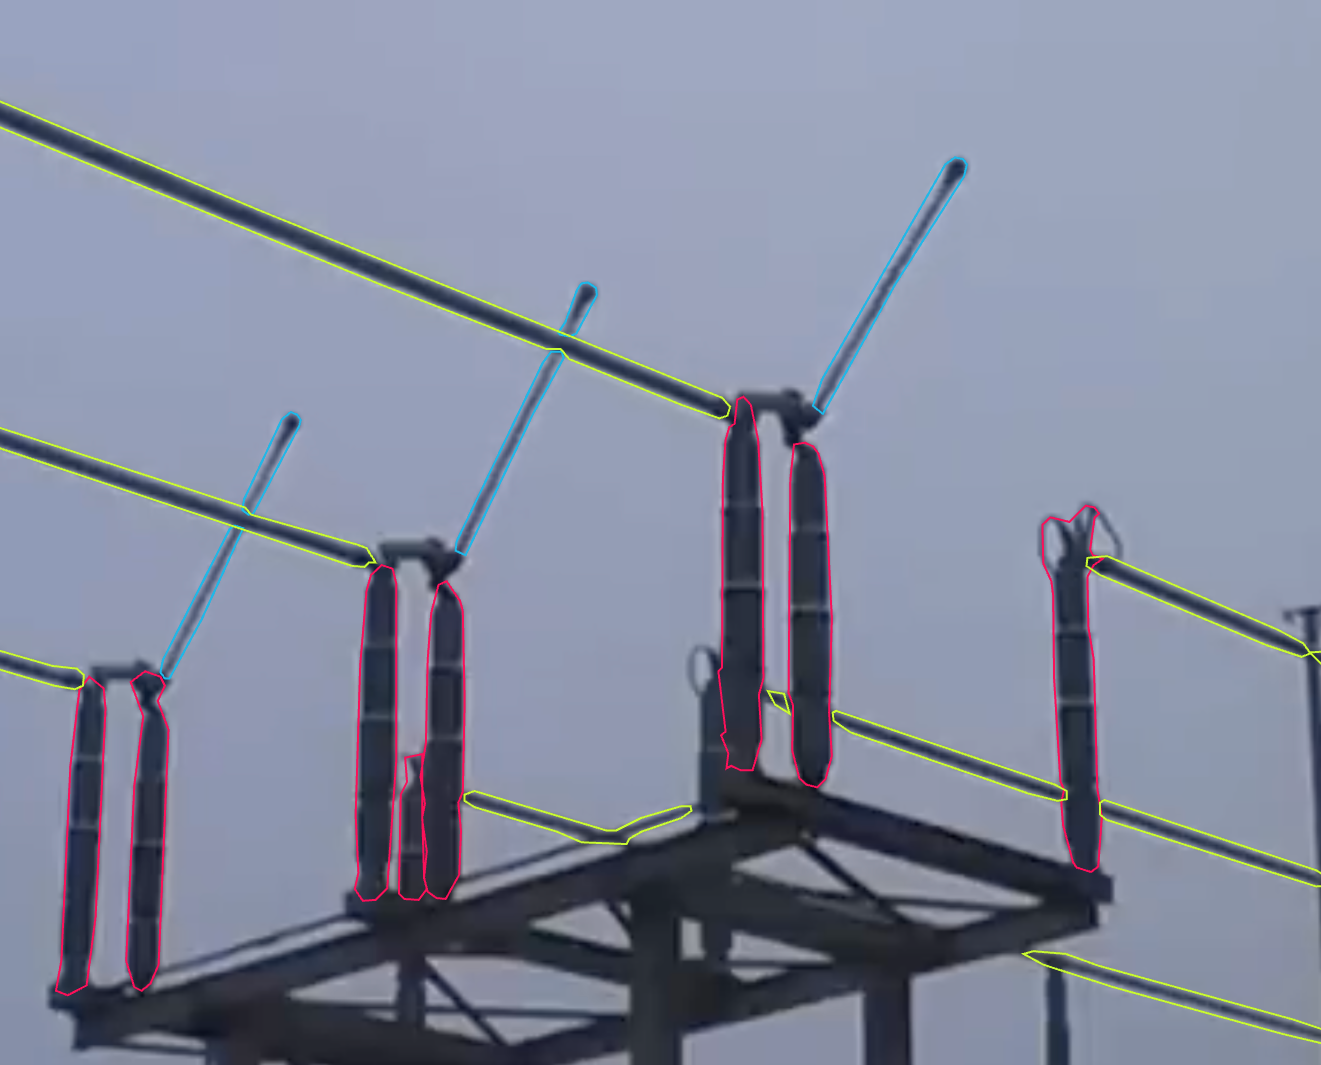
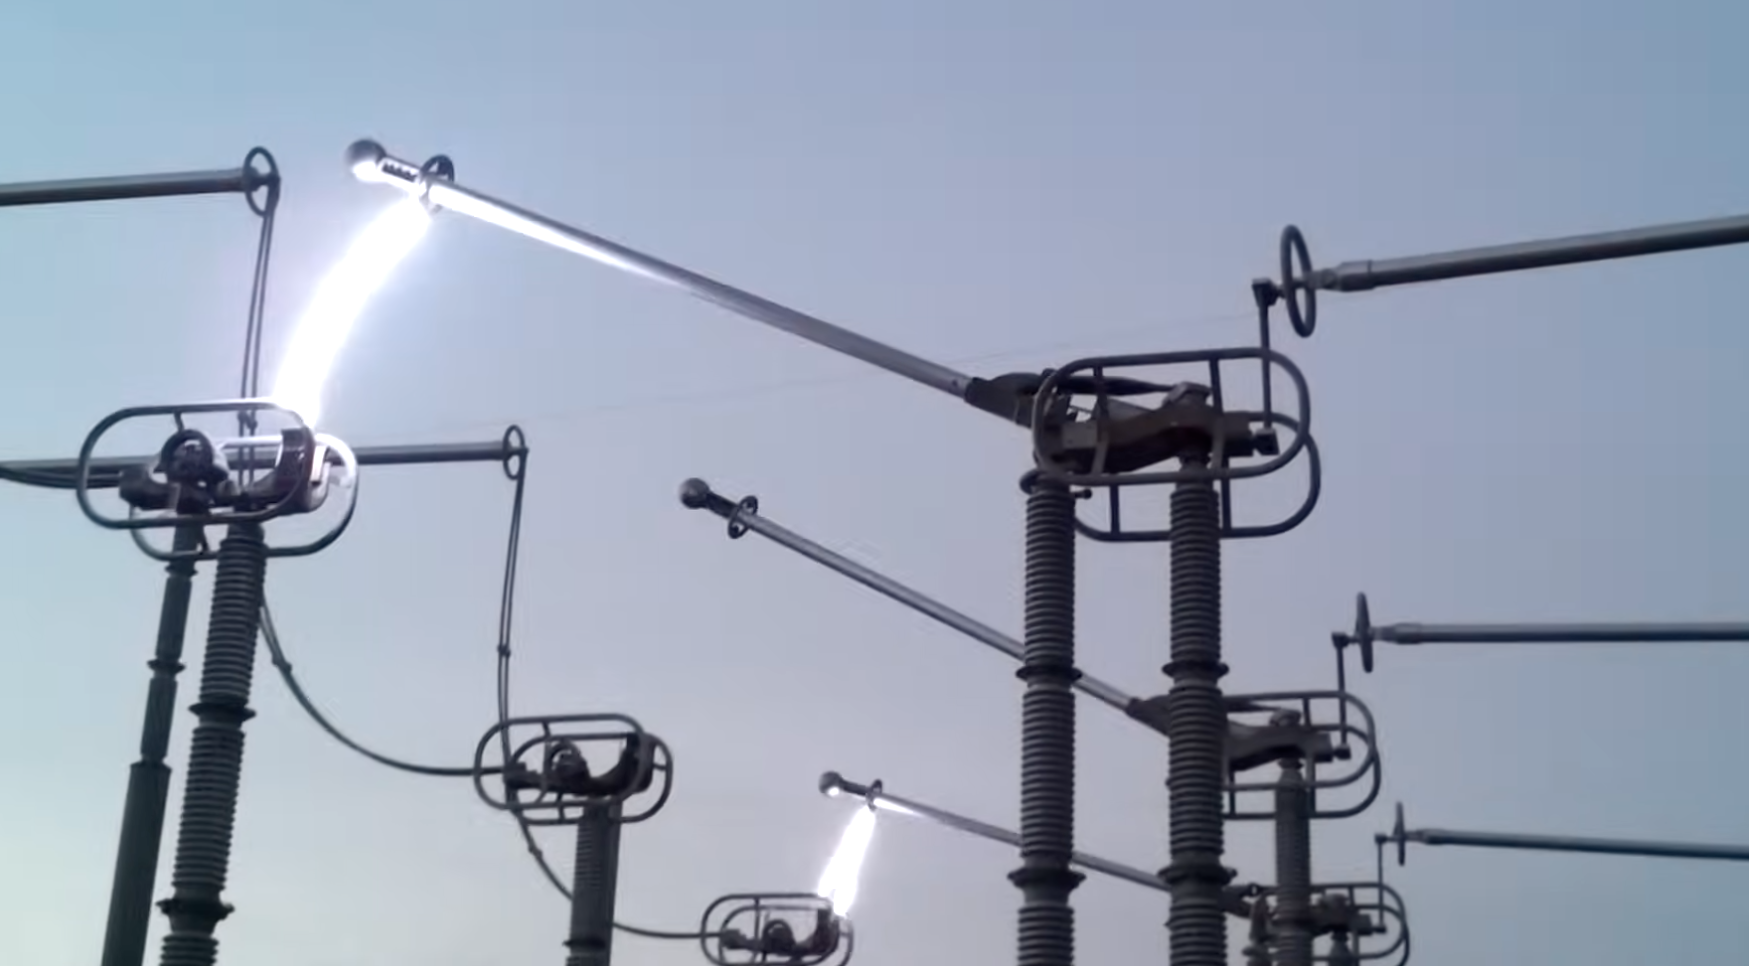
Monitor switchgear, transformers, insulators, and surrounding areas with visual, thermal, and robotic sensors capturing what actually happens in unmanned sites.
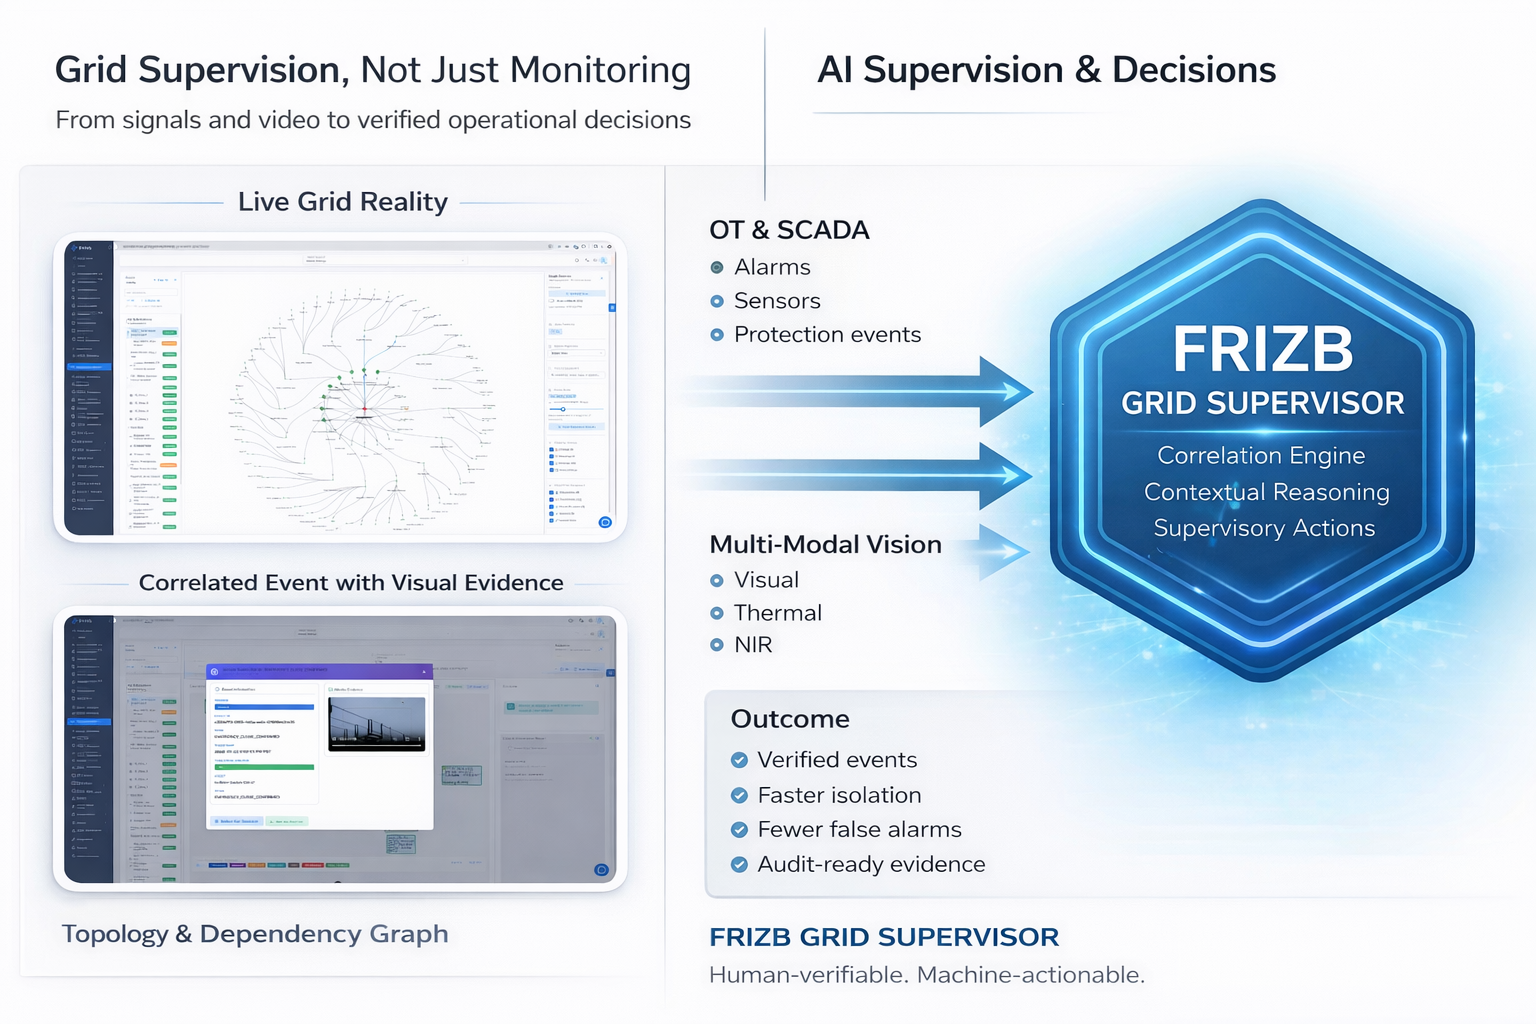
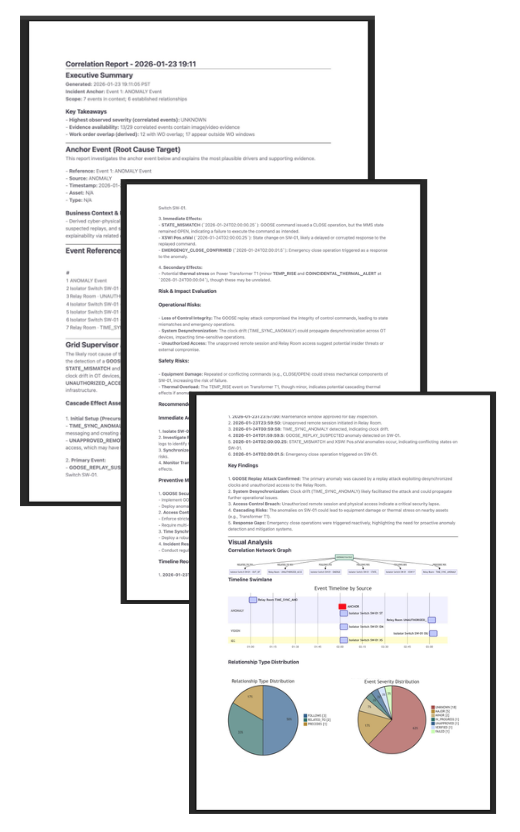
Map OT Events to Visual Proof
Correlate DNP3, IEC 61850, and SCADA events with real imagery to reveal true causes behind alerts, equipment motion, wildlife, debris, or weather stress.
Send Work orders With Visuals
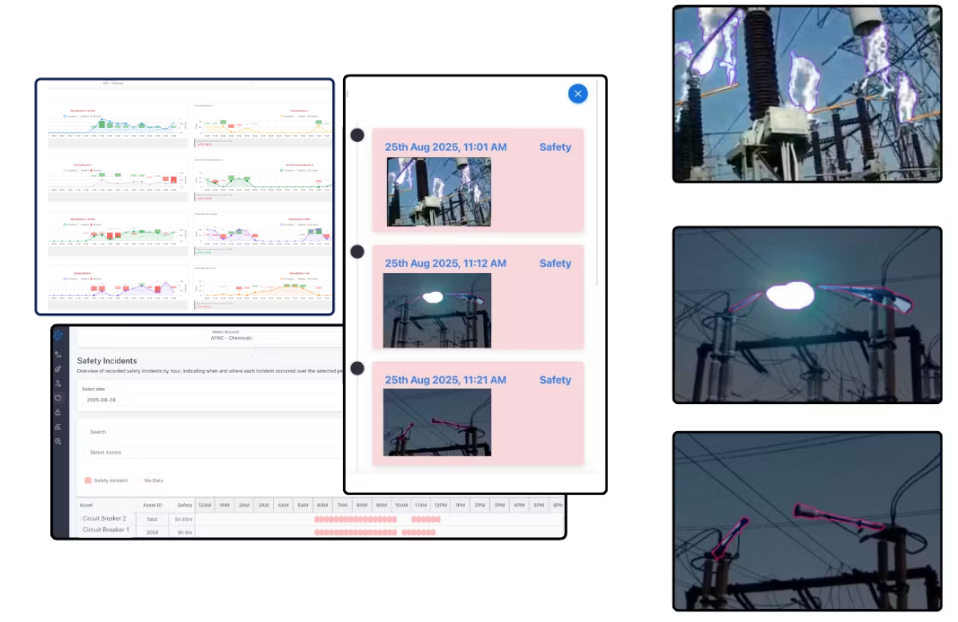
Trigger timely alerts, workflows, and reports backed by visual evidence. Reduce outages, avoid wildfire risks, and keep operations stable.
Grid Sentinel continuously analyzes the motion, timing, alignment, and mechanical consistency of reclosers, load break switches, and disconnects. By correlating visual behavior with OT events, it surfaces drift, misalignment, and abnormal travel patterns long before they cause misoperations or outages.
Grid Supervisor monitors radiator fans, oil pumps, cooling fins, bushings, and auxiliary systems to detect early thermal anomalies and mechanical drift. By combining visual cues with OT signals, it identifies transformer stress conditions well before alarms or temperature thresholds activate.
Grid Supervisor provides real time visibility into relay rooms, control cabinets, communication racks, and auxiliary structures. It detects environmental drift, enclosure changes, thermal anomalies, and emerging hardware issues that may impact protection reliability or cause nuisance trips.
Grid Supervisor provides verifiable visual evidence of the conditions that led to a Public Safety Power Shutoff (PSPS). By combining fixed-camera views, drone footage, weather inputs, and OT event data, operators can document the actual field conditions that made continued energization unsafe.
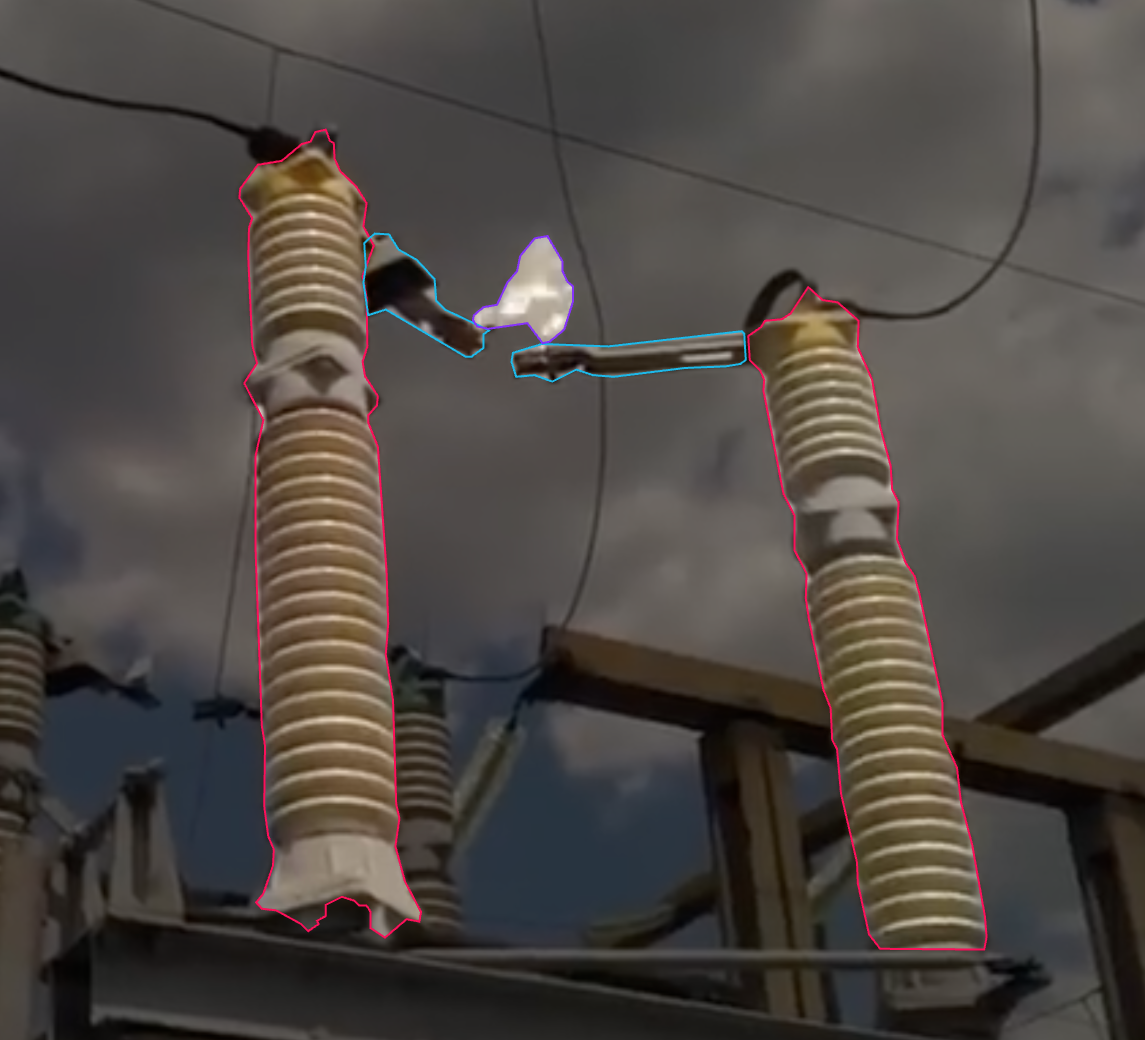
Grid Supervisor captures early visual indicators of potential ignition sources such as arcs, equipment heating, conductor movement, foreign object contact, and vegetation intrusion. This provides operators with documentation and real-time awareness of fire-risk conditions, especially in unmanned or remote substations.
Grid Supervisor identifies debris, wildlife intrusion, vegetation encroachment, ice accumulation, fallen objects, or material displacement across substations. These issues often go unnoticed until they trigger faults, clearance violations, or mechanical stress, making early detection essential to reliability.
Unlocking Operational Context is More Than Object Detection & Alerts.
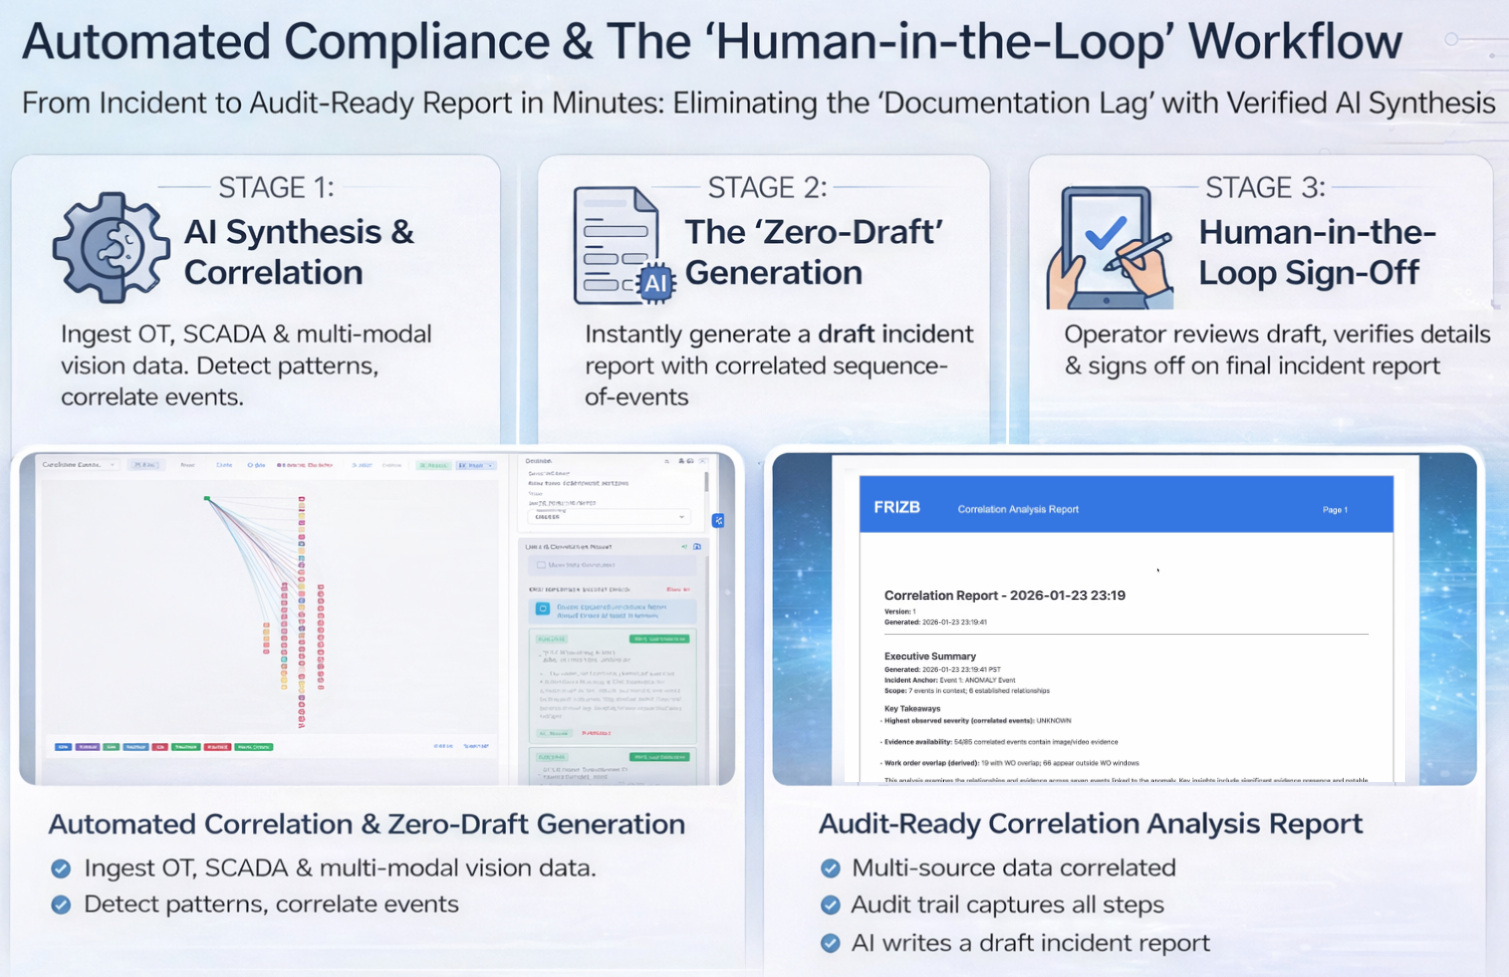
Correlate simultaneous OT events, switching anomalies, and cooling behavior with synchronized visual evidence to reveal root-cause patterns invisible to standalone telemetry.
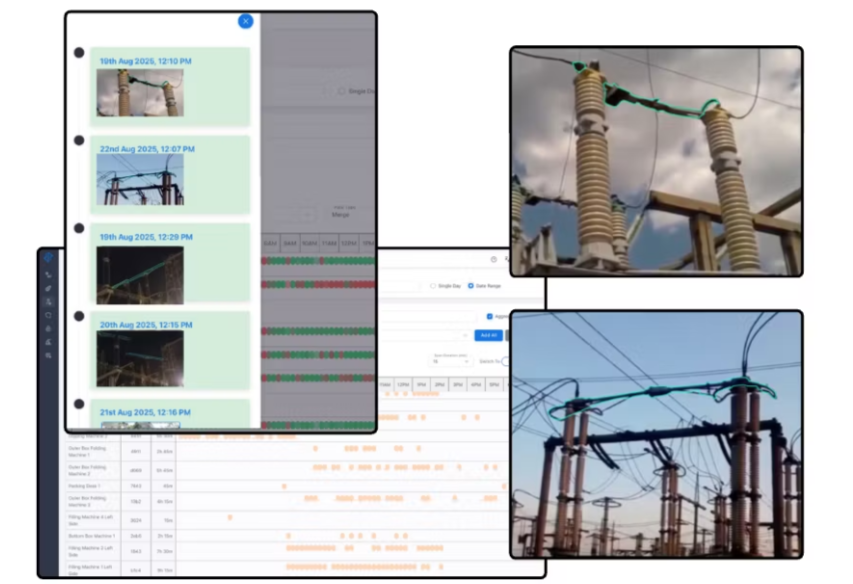
Generate drift scores for reclosers, switches, and cooling assets by analyzing motion timing, cycle consistency, and alignment changes across days or seasons.
Track gradual changes in vegetation, debris, ice buildup, or structural conditions to surface long-term environmental risks that impact grid reliability.
Build a blue print of all the material, manpower movements to review the deviations from baseline to optimize layouts, processes and trainings.
Capture the operational metrics in detailed reports and dashboards to track across timelines and sites to build and apply BKMs across sites

Deploy with confidence that the sensitive operational data stays in-house under the IT perimeter security while leveraging camera, IT & OT assets using intelligent software layer.